Hail Creek Mine
Geography and Climatology
The Hail Creek mine is located in central Queensland on the western slopes of the Great Dividing Range, approximately 90
To characterise the terrain surrounding the Hail Creek mine, we use 9 arc second elevation data from the
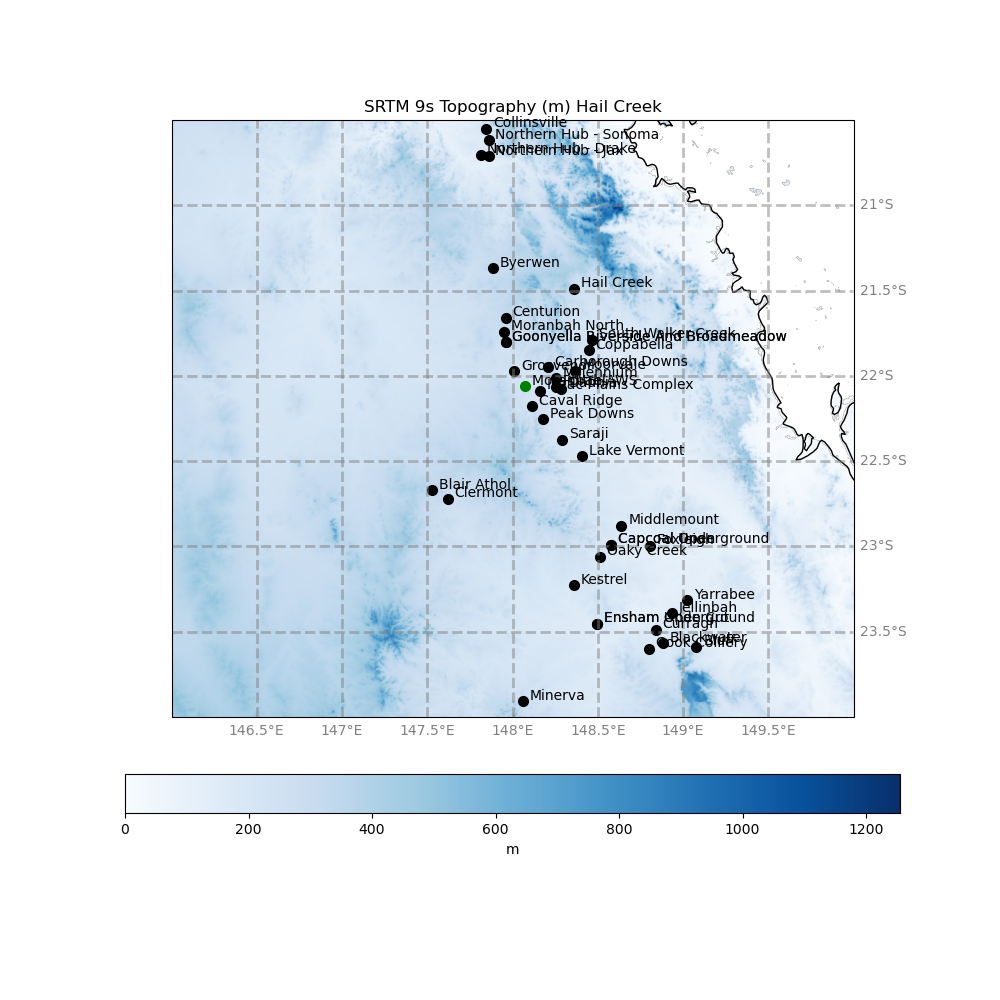
Figure 3 illustrates the regional orography and key geographical features relevant to this study, including the Pacific Ocean coastline, the Great Dividing Range running parallel to the coast, the locations of nearby mines (shown by black markers), and the Moranbah Airport Automatic Weather Station
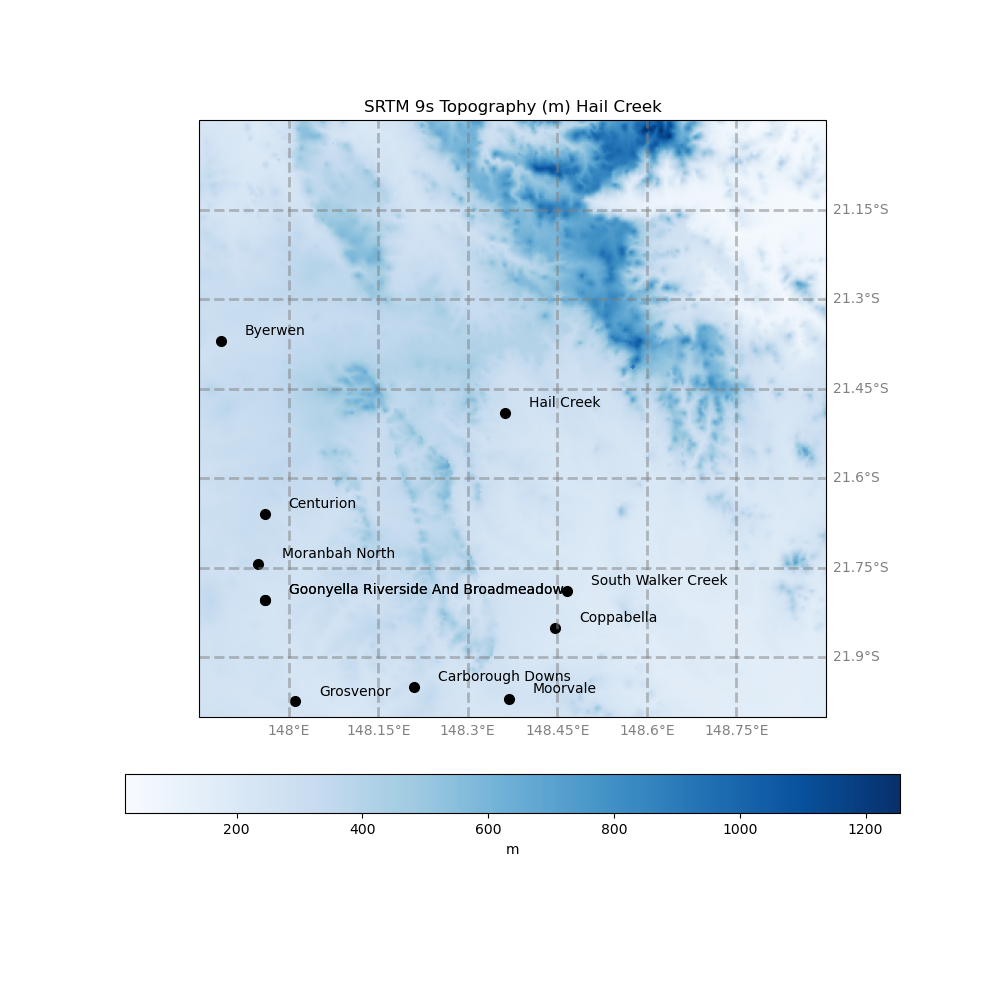
The mine itself is situated within a northwest-southeast oriented valley, with elevations on the northeastern side rising to approximately 1,200 m and those on the southwestern side reaching about 400 m. The valley is approximately 30 km wide, as shown in Figure 4 below.
Large scale meteorological features of the Australian climate relevant to the Hail Creek study are described by the Bureau of Meteorology
It is a belt of high pressure that encircles the globe in the middle latitudes.
The position of the sub-tropical ridge plays an important part in the way the weather in Australia varies from season to season.
During the warmer half of the year in southern Australia (November to April), the sub-tropical ridge is generally located to the south of the continent…
In autumn the sub-tropical ridge moves northward and remains over the Australian continent for most of the colder half of the year in southern Australia (May to October). Conditions along the ridge, under the influence of the high-pressure systems dry and descending air, tend to be stable and drier.
Two illustrative examples of the influence of the
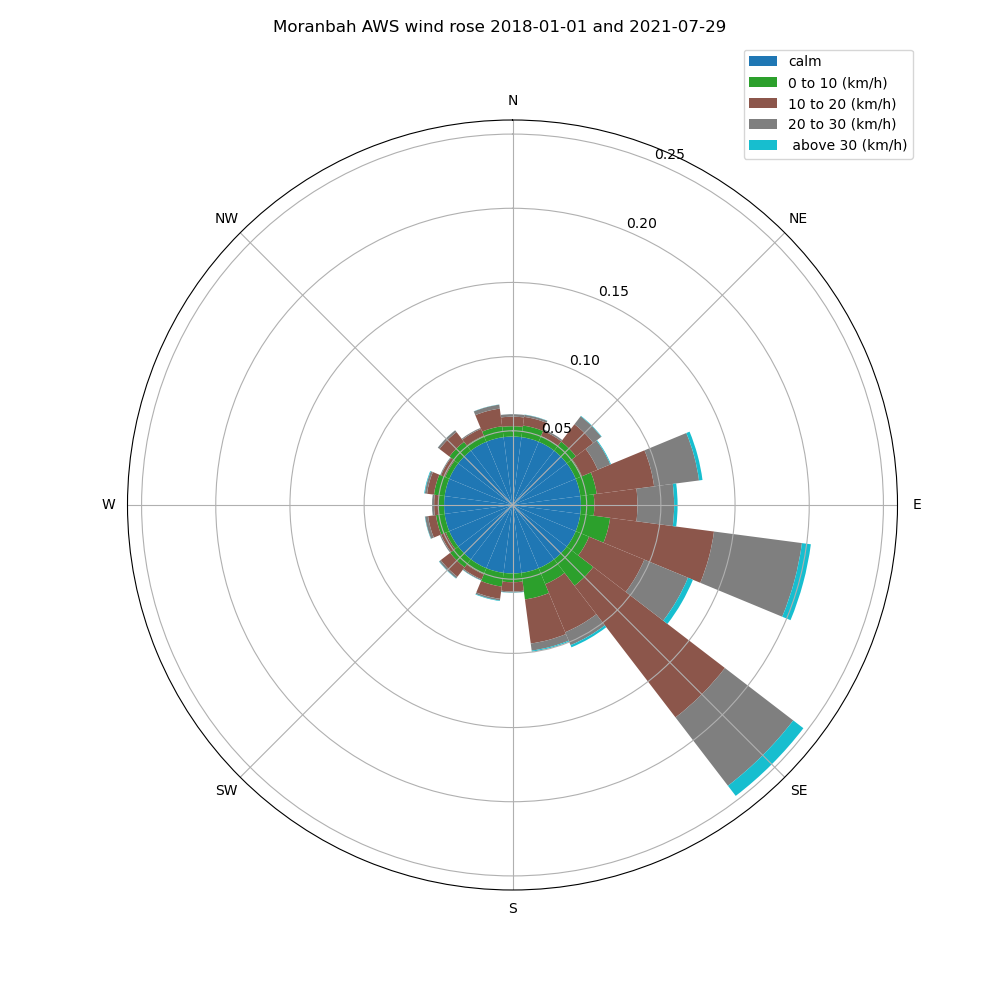
Climatologically, the Hail Creek mine lies north of the
Coal Mine
The mine extracts coal from the Elphinstone Seam and Hynds Seam
The mine pit is not captured in the
LIDAR measurements conducted in October 2022 indicate that, at that time, coal extraction occurred at depths of approximately 180-200 m below ground level, with the pit floor reaching depths of about 220-250 m below the surface
Coal Production
During the sale of its interest in the mine, Rio Tinto reported that in 2017 the Hail Creek operation produced approximately 9.4
The activity data used in
The Queensland Government publishes two primary statistical datasets related to coal production. The first,
- Gross-Raw Output:
This is the amount, in tonnes, of raw coal produced as a result of mining activities undertaken at the mine during the period. Irrespective of whether or not some/all of that coal may be subsequently sold without being beneficiated, in providing this figure, the assumption is to be made that all coal mined at the coal face(s) during the period is delivered to the Run-of-Mine stockpile.
- Gross-Raw Feed:
This is the amount, in tonnes, of raw coal received by the processing plant and any tonnage bypassing the plant to become saleable product during the reporting period.
- Net Output:
The total amount, in tonnes, of saleable coal produced during the period, i.e. washed saleable product PLUS other saleable product. For tailings recovery operations, the total saleable output for the period is required.
An extract of the Hail Creek coal production data from these statistics is provided in Table 4.
| Financial year | Coal type | Activity Discards | Gross Raw Feed | Gross Raw Output | Net Output |
|---|---|---|---|---|---|
| FY2025 | Coal | 16154750 | 10807512 | ||
| FY2025 | Coking | 4452342 | |||
| FY2025 | Thermal | 3469428 | |||
| FY2025 | Wash Discard | 8803589 | |||
| FY2024 | Coal | 16575361 | 9592586 | ||
| FY2024 | Coking | 3895983 | |||
| FY2024 | Thermal | 3977955 | |||
| FY2024 | Wash Discard | 9598043 | |||
| FY2023 | Coal | 16835413 | 10092999 | ||
| FY2023 | Coking | 4545708 | |||
| FY2023 | Thermal | 3082427 | |||
| FY2023 | Wash Discard | 9389503 | |||
| FY2022 | Coal | 17436110 | 10783931 | ||
| FY2022 | Coking | 5140618 | |||
| FY2022 | Thermal | 2658374 | |||
| FY2022 | Wash Discard | 9766081 | |||
| FY2021 | Coal | 13024250 | 10594483 | ||
| FY2021 | Coking | 4698426 | |||
| FY2021 | Thermal | 1024118 | |||
| FY2021 | Wash Discard | 7223108 | |||
| FY2020 | Coal | 14878458 | 9468696 | ||
| FY2020 | Coking | 5441586 | |||
| FY2020 | Thermal | 3014628 | |||
| FY2020 | Wash Discard | 3819050 | |||
| FY2019 | Coal | 15616001 | 7660496 | ||
| FY2019 | Coking | 5535276 | |||
| FY2019 | Thermal | 3612680 | |||
| FY2019 | Wash Discard | 2386331 | |||
| FY2018 | Coal | 10000076 | 10203613 | ||
| FY2018 | Coking | 5356850 | |||
| FY2018 | Thermal | 4175818 | |||
| FY2018 | Wash Discard | 967078 | |||
| FY2017 | Coal | 9166559 | 9195752 | ||
| FY2017 | Coking | 5178543 | |||
| FY2017 | Thermal | 4032202 | |||
| FY2017 | Wash Discard | 1303906 | |||
| FY2016 | Coal | 10439914 | 10228814 | ||
| FY2016 | Coking | 6071692 | |||
| FY2016 | Thermal | 3455348 | |||
| FY2016 | Wash Discard | 1523574 | |||
| FY2015 | Coal | 11709624 | 11614548 | ||
| FY2015 | Coking | 6392465 | |||
| FY2015 | Thermal | 3110521 | |||
| FY2015 | Wash Discard | 2287804 | |||
| FY2014 | Coal | 11726258 | 11911568 | ||
| FY2014 | Coking | 6748102 | |||
| FY2014 | Thermal | 989488 | |||
| FY2014 | Wash Discard | 3988668 | |||
| FY2013 | Coal | 11804946 | 12063330 | ||
| FY2013 | Coking | 7068582 | |||
| FY2013 | Wash Discard | 4736364 | |||
| FY2012 | Coal | 12767641 | 12817071 | ||
| FY2012 | Coking | 7485638 | |||
| FY2012 | Wash Discard | 5282003 | |||
| FY2011 | Coal | 12025272 | 11983327 | ||
| FY2011 | Coking | 6878982 | |||
| FY2011 | Wash Discard | 5146290 | |||
| FY2010 | Coal | 12349908 | 12554146 | ||
| FY2010 | Coking | 6631738 | |||
| FY2010 | Wash Discard | 5718170 |
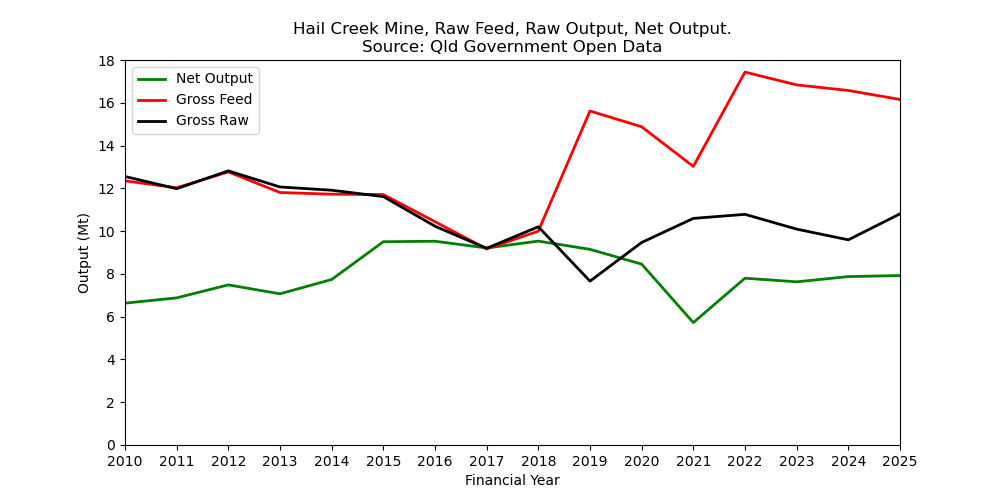
This information is summarised in Figure 6 below, which indicates a qualitative change in production characteristics following the transfer of ownership from BHP to Glencore. While this shift may partly reflect changes in data definitions or reporting practices, it is also possible that the wash plant began processing coal from additional sources beyond the Hail Creek mine.
For FY 2019 (July 2018-June 2019),
For FY 2020, we were unable to identify the source of the 5.8
The second annually updated dataset is
An extract of the Hail Creek coal production data from these statistics is provided in Table 5.
| Calendar Year | Total Net Output | Total Gross Raw Output | |
|---|---|---|---|
| 2022 | 9833100 | ||
| 2021 | 11629180 | ||
| 2020 | 9849473 | ||
| 2019 | 8751078 | ||
| 2018 | 9028926 | ||
| 2017 | 9500316 |
It is worth noting that in calendar year (CY) 2019, the Gross Raw Output of the 10 th ranked mine was 10,443,890
These datasets are difficult to reconcile and interpret consistently. As the primary objective of this work is the development and demonstration of software tools, we leave the resolution and interpretation of these data discrepancies to the reader and the respective data providers.
Methane Emissions
At the time of writing, several emission estimates are available for different time periods. These estimates are summarised in Table 6 below.
| Source | Period | Method | |
|---|---|---|---|
| 230.0 | Apr 2018 - Dec 2019 | TROPOMI -> CSF | |
| 42.9 | Apr 2018 - Dec 2018 | TROPOMI -> GEOS-Chem -> Ensemble Kalman Filter | |
| 19.5 | Jan 2023 - Jun 2023 | TROPOMI -> WRF -> CMAQ | |
| 219 | Apr 2018 - Dec 2023 | TROPOMI -> WFMD -> CSF | |
| 122.6 | 31 May 2022 3 Jun 2022 | Aircraft | |
| 84 | 28 Sep 2023 | Aircraft | |
| 99 | 29 Sep 2023 | Aircraft |
Please note that the Open Methane dataset is currently in a beta stage and is undergoing recalculation for 2023. The official release of the validated dataset is expected by the end of 2025 (private communication, Lindsey Gaines, The Superpower Institute, 23 July 2025).
Methane emissions reported by Glencore under the National Greenhouse and Energy Reporting (NGER) scheme are not publicly available; however, it is likely that they are calculated using one of the emission factors recommended under the NGER framework, applied to reported activity data.
Implied Emission Factor
The