This orbit was selected for analysis because it is one of only two CSF, success cases featuring southwesterly flow over Hail Creek during the study period from April 2018 to December 2019 (the other being orbit 9885 from 10th September 2019). This provides an opportunity to explore potential background concentrations using TROPOMI images from the previous day, specifically orbits 9431 and 9871, respectively.
In this case, the dominant south-westerly flow places the downwind box over the mountainous terrain east of the mine, resulting in only a limited number of available pixels. The primary value of this case lies in demonstrating how background concentrations can be estimated.
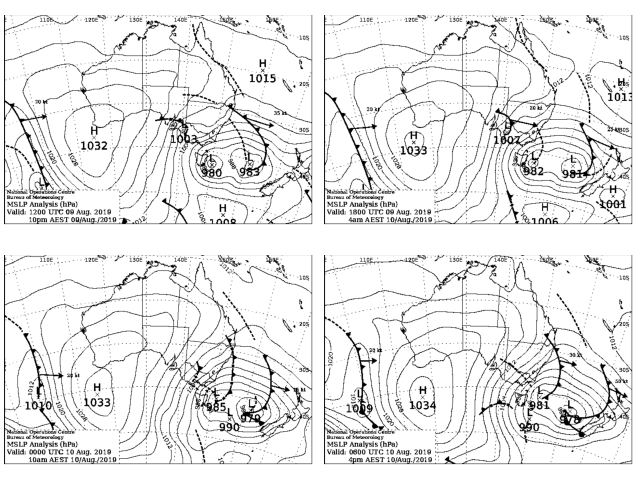
Mean Sea Level Pressure
Mean sea level pressure analysis indicates a steady south-westerly flow over the Hail Creek mine, driven by the passage of a low pressure trough through the region. This flow transports air masses originating from Victoria and western New South Wales toward Hail Creek. During this period, the STR is positioned to the north of the site.
During the 24 hours preceding the satellite overpass, winds remained between 240° and 270°, with speeds around 25 () on the evening of 9th August, decreasing overnight to 7.4 () before increasing again into the mid-20s. Low dew point temperatures and relative humidity below 35% were observed. Owing to the arrival of a cooler south-westerly air mass, there is no evidence of UNKNOWN development in the observations.
Table 23. Moranbah Airport AWS observations between 2019-08-09 4Z and 2019-08-10 4Z. Download
Date
Air temperature ()
Dew point ()
Wind speed ()
Wind direction in degrees true
09/08/2019 04:00
27.0
-0.9
20.5
260
09/08/2019 04:30
27.4
-2.4
24.1
260
09/08/2019 05:00
27.3
-2.5
24.1
250
09/08/2019 05:30
26.9
-2.8
24.1
250
09/08/2019 06:00
26.9
-1.9
22.3
270
09/08/2019 06:30
26.0
-1.7
24.1
250
09/08/2019 07:00
25.1
-1.6
22.3
240
09/08/2019 07:30
24.3
-1.5
20.5
250
09/08/2019 08:00
23.3
-1.6
14.8
260
09/08/2019 08:30
22.4
-1.6
11.2
260
09/08/2019 09:00
20.6
-1.2
9.4
260
09/08/2019 09:30
19.0
-0.9
9.4
270
09/08/2019 10:00
18.3
-0.5
9.4
280
09/08/2019 10:30
18.8
-1.6
13.0
270
09/08/2019 11:00
19.2
-3.0
13.0
260
09/08/2019 11:30
17.4
-2.8
11.2
240
09/08/2019 12:00
16.7
-2.9
9.4
240
09/08/2019 12:30
18.2
-2.7
16.6
240
09/08/2019 13:00
18.0
-2.8
14.8
240
09/08/2019 13:30
17.6
-3.2
11.2
250
09/08/2019 14:00
17.4
-3.4
11.2
250
09/08/2019 14:30
15.2
-3.2
7.6
280
09/08/2019 15:00
15.5
-2.9
9.4
260
09/08/2019 15:30
16.0
-3.0
9.4
260
09/08/2019 16:00
15.8
-3.6
11.2
250
09/08/2019 16:30
15.2
-3.6
13.0
250
09/08/2019 17:00
15.4
-4.0
13.0
230
09/08/2019 17:30
14.2
-4.5
11.2
230
09/08/2019 18:00
14.7
-5.1
14.8
220
09/08/2019 18:30
13.9
-5.3
13.0
210
09/08/2019 19:00
13.6
-5.0
13.0
220
09/08/2019 19:30
12.6
-4.9
9.4
230
09/08/2019 20:00
11.1
-4.9
5.4
220
09/08/2019 20:30
11.1
-4.5
9.4
270
09/08/2019 21:00
10.5
-4.7
7.6
270
09/08/2019 21:30
11.4
-3.5
9.4
240
09/08/2019 22:00
15.5
-2.9
11.2
210
09/08/2019 22:30
17.2
-2.4
18.4
210
09/08/2019 23:00
19.1
-0.8
16.6
210
09/08/2019 23:30
20.0
-1.2
18.4
210
10/08/2019 00:00
20.6
-1.2
20.5
240
10/08/2019 00:30
20.8
-1.7
20.5
230
10/08/2019 01:00
21.0
-2.1
20.5
230
10/08/2019 01:30
22.3
-1.7
20.5
220
10/08/2019 02:00
23.1
-1.8
18.4
270
10/08/2019 02:30
23.2
-4.0
16.6
270
10/08/2019 03:00
23.9
-1.8
24.1
260
10/08/2019 03:30
24.0
-3.3
27.7
270
10/08/2019 04:00
24.2
-2.4
24.1
240
TROPOMI
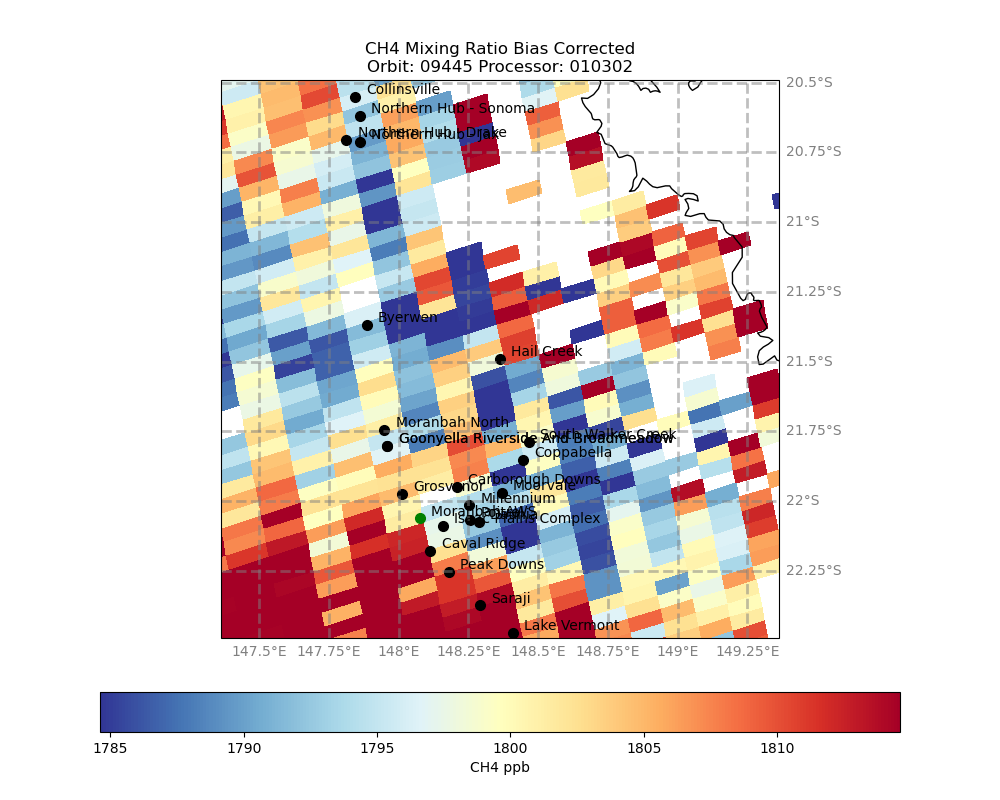
A one degree box around Hail Creek shows elevated concentrations in the southwest corner, likely reflecting emissions transported from New South Wales and Victoria. Increased concentrations are also visible east of Hail Creek. Numerous pixels are missing over the Dividing Range, located downwind of the mine. This limits the number of available pixels in the downwind box for the CSF method and renders both the TM and IME approaches inapplicable. See Figure 46
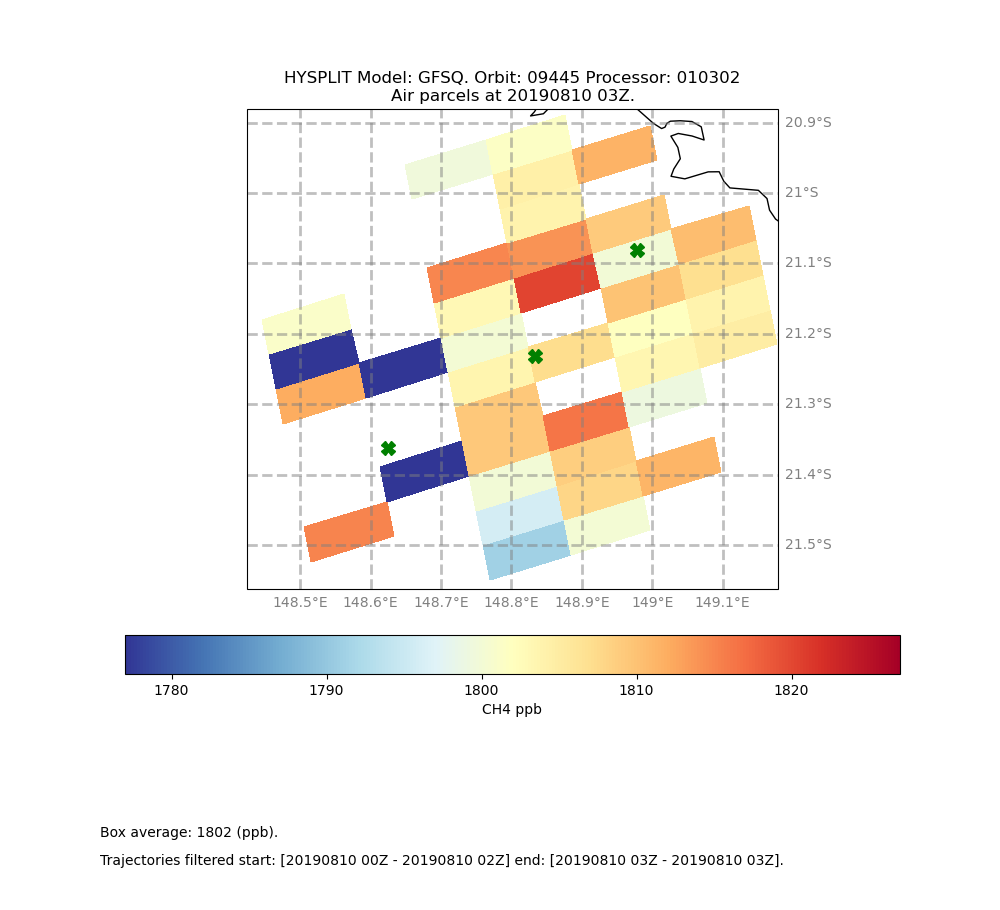
HYSPLIT forward modelling indicates that emissions travel across the Dividing Range to the northeast of Hail Creek. When these trajectories are overlaid on the TROPOMI image, only about three hours of emissions, those released at 2019-09-08 00Z, 01Z, and 02Z, are located over land. Beyond this point, the plume extends over the ocean, where the TROPOMI retrieval algorithm does not operate. See Figure 47.
Figure 47. HYSPLIT forward trajectories. Hourly emission puffs emitted between 20190810 00Z and 20190810 03Z. TROPOMI. Orbit 09445, Processor 010302.
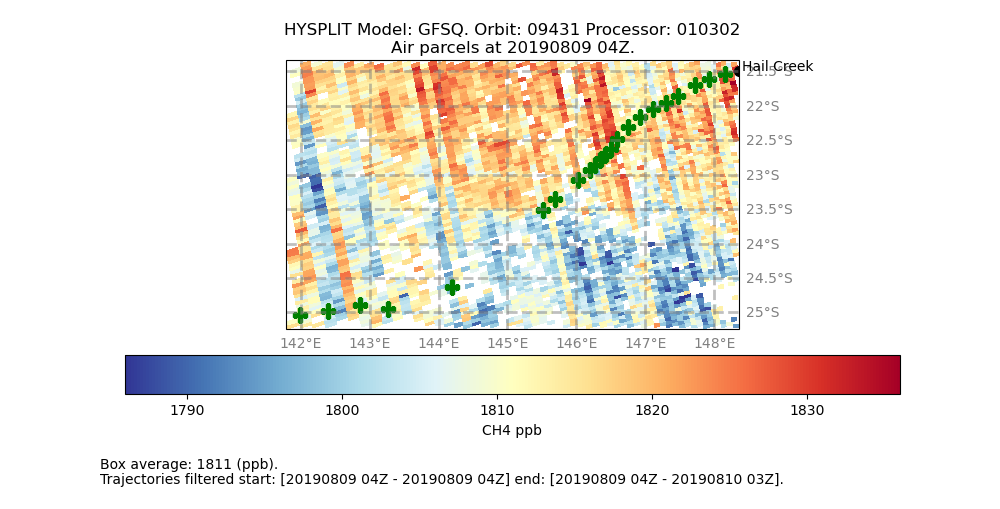
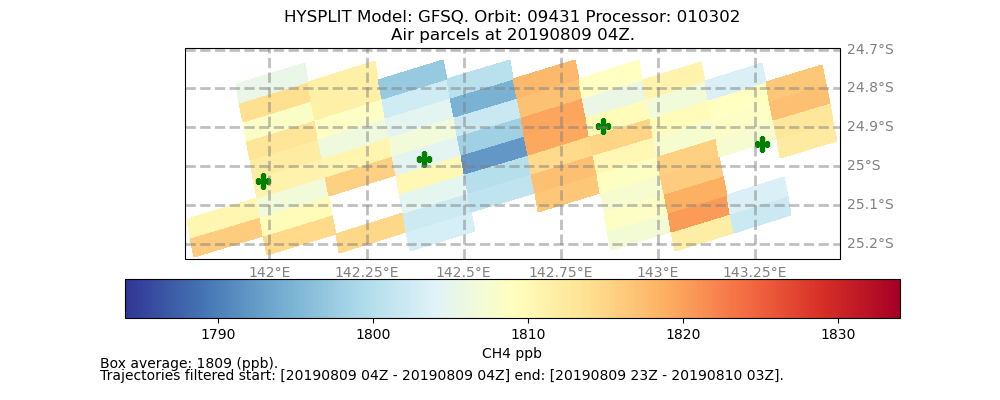
HYSPLIT backward modelling, extended to the TROPOMI overpass from the previous day (orbit 09431), indicates that background concentrations may be estimated by tracking the advected air parcels. See Figure 48.
Figure 48. HYSPLIT backward trajectories. Hourly background puffs emitted at 2019080904Z reaching Hail Creek mine between 2019080904Z and 201081003Z. TROPOMI. Orbit 09431. Processor 010302.
The locations of the four background air parcels, situated in the lower left portion of the domain between 142°E and 143.5°E and later reaching Hail Creek to mix with emission puffs released between 2019-08-09 23Z and 2019-08-10 02Z, are provided in Table 24.
Table 24. HYSPLIT backward trajectories. Location at time of the background image for orbit 09431. Download
Arrival at Hail Creek
Latitude ° S
Longitude ° E
2019-08-10 02Z
-25.039
141.983
2019-08-10 01Z
-24.983
142.397
2019-08-10 00Z
-24.896
142.858
2019-08-09 23Z
-24.944
143.269
Using these coordinates, we delineate a box from [141.75°E, -25.25°S] to [143.5°E, -24.7°S] and compute an average background concentration of 1809 () (see Figure 49). While this is useful for illustration, the choice of box size is inherently arbitrary without information on the turbulent diffusion tensor, and a more robust estimate would normally require a CTM. This approach is likely analogous to the algorithm used by Palmer, et al., 2021 .
Figure 49. HYSPLIT backward trajectories. Location of background air parcels emitted at 20190809 4Z which will mix with Hail Creek mine emissions between 2019080923Z and 2019081002Z. Detail of the previous image.
It should be noted that substantial changes can occur to an air parcel over a 23 hour transport period. The parcel will undergo turbulent diffusion (approximated here through spatial averaging), may accumulate emissions from additional sources along its path, and may be diluted by expansion or by vertical mixing into layers with different concentrations. These factors require considerable caution when interpreting the results. Nevertheless, the approach outlined above provides a background concentration estimate with at least some physical basis and may serve as a useful foundation for more rigorous concentration modelling.
HYSPLIT modelling indicates that, in this case, it is feasible to determine the origin of the air mass into which the emissions are entrained. In principle, the previous day's TROPOMI image could be used to initialise an atmospheric dispersion model. However, determining background concentrations from backward trajectories should normally be carried out using a properly initialised chemical transport model CTM. The manual analysis presented here is intended only to illustrate the concept and to provide basic tools for interpreting the model output.
CSF
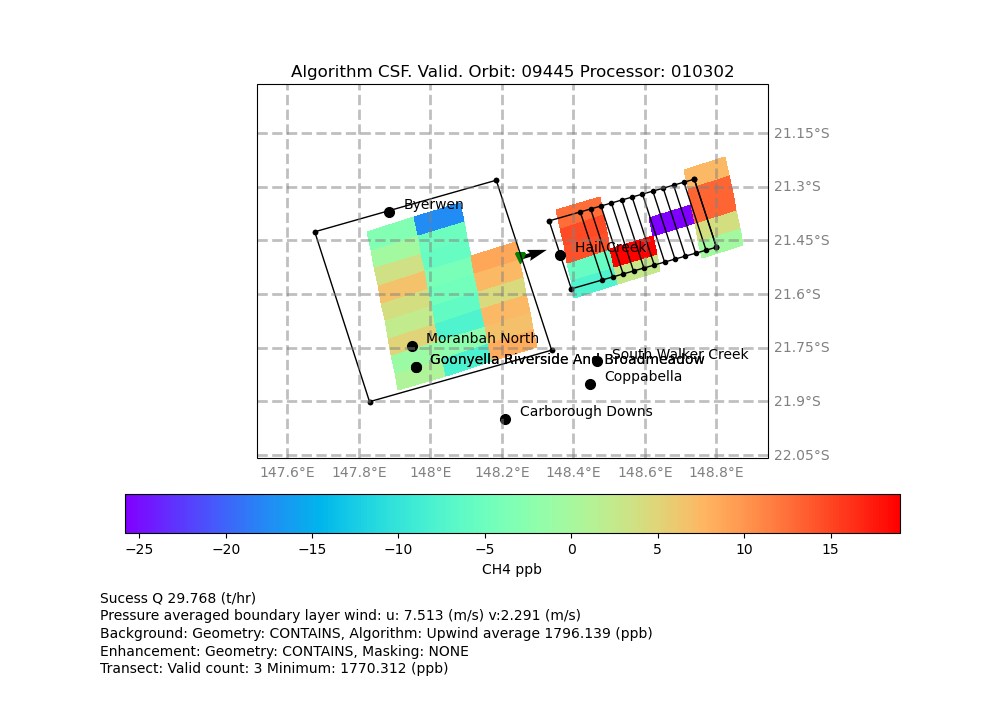
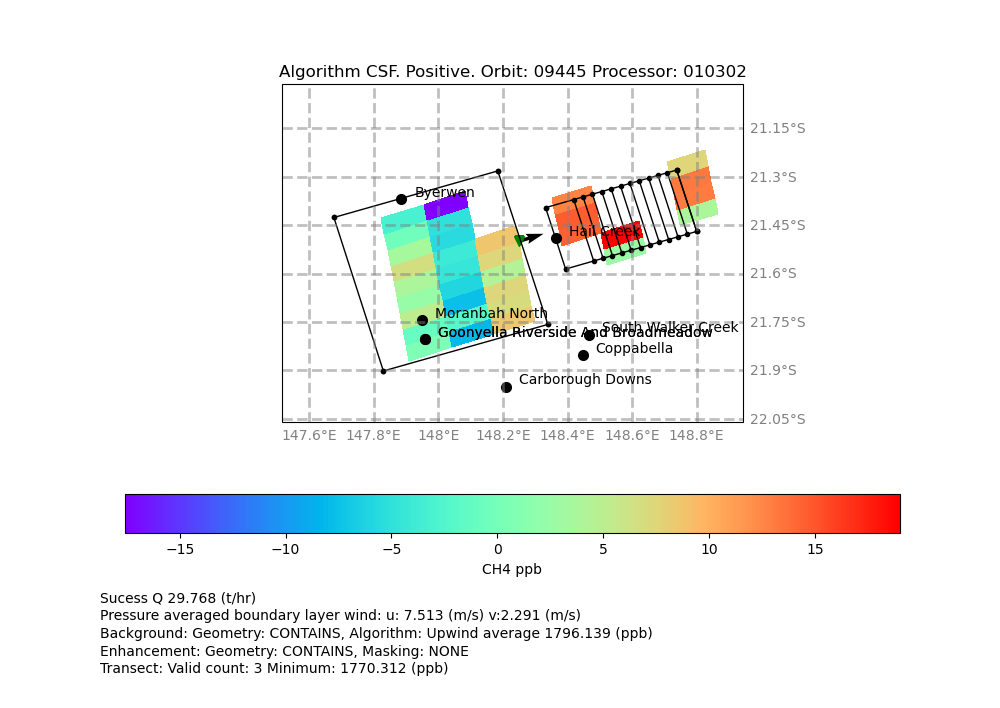
The CSF algorithm, as implemented in our software, completed successfully and produced an emission estimate of 29.768 () (260.769 () ). The wind speed was 7.854 (), and the algorithm used an upwind background value of 1796 (). This may be compared with the 1809 () background suggested by the HYSPLIT backward trajectory analysis, and with the domain median of 1806 (). The upwind box contains 24 valid pixels, while only 13 valid pixels fall within the downwind box. See Figure 50.
It should be noted that the CSF derived downwind box direction diverges from that indicated by the HYSPLIT modelling, likely due to the large number of missing pixels, as the CSF algorithm relies solely on the available observations.
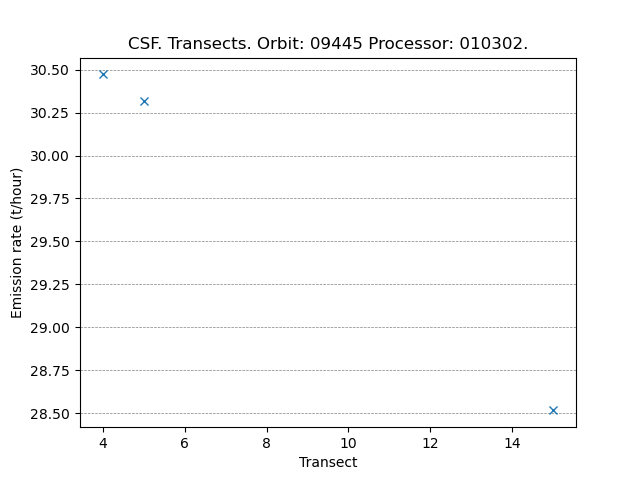
Inspection of the transects shows estimated emission rates ranging from 28.5 to 30.5 (), with only transects 4, 5, and 15 meeting the validity criteria; the remaining transects are rejected due to an insufficient number of pixels. See Figure 52.
TM cannot be applied in this case due to the large number of missing pixels.
IME
IME cannot be applied in this case due to the large number of missing pixels.
Summary
This case study was selected because meteorological analysis indicates persistent south-westerly winds during the 24 hours preceding the TROPOMI overpass. Due to the mountain range east of the mine, this wind direction results in good pixel coverage upwind but poor pixel coverage downwind of the source.
HYSPLIT backward modelling enabled us to narrow down the background air mass location 24 hours earlier (orbit 9431). Averaging concentrations within a box surrounding the relevant air parcel locations yields a background value of 1809 ().
Although the CSF algorithm reports a successful calculation for this orbit, the results are highly uncertain due to the very limited number of pixels intersecting the transects. The upwind box has good pixel coverage, yielding a background concentration of 1796 (), about 13 () lower than the estimate derived from the HYSPLIT based background analysis.
Both the TM and IME methods are not applicable in this case due to limited pixel coverage over the mountainous downwind region and the presence of steady wind crossing the box boundary.