In this section, we briefly describe the HYSPLIT model, a chemical transport and dispersion model with mixed Eulerian-Lagrangian formulation. HYSPLIT can be operated in either trajectory or concentration mode. In trajectory mode, each simulated path can be interpreted as the centreline of an emission puff, with turbulent diffusion representing the spreading of material around that trajectory. Trajectories may be generated in either forward or backward time, enabling analysis of both plume transport and source attribution.
For domains located in Australia, HYSPLIT can be initialised through the READY Rolph, et al., 2017 interface using one of four global meteorological datasets:
Global Data Assimilation System (GDAS) at 1.0° spatial resolution, available at 3 hourly intervals from 2006 to the present.
Global Forecast System (GFS) at 0.25° spatial resolution, available hourly from June 2019 onward.
Global Data Assimilation System (GDAS) at 0.5° spatial resolution, available at 3 hourly intervals from September 2007 to June 2019.
NCEP/NCAR Reanalysis at 2.5° spatial resolution, available at 6 hourly intervals from 1948 to the present.
Because this study involves complex local meteorological conditions, we used GFS data, which provide the highest available spatial and temporal resolution (0.25° × 0.25°, hourly). GFS data are available only from June 2019 onward, which restricts the HYSPLIT analysis to S5P orbits from 8451 onward.
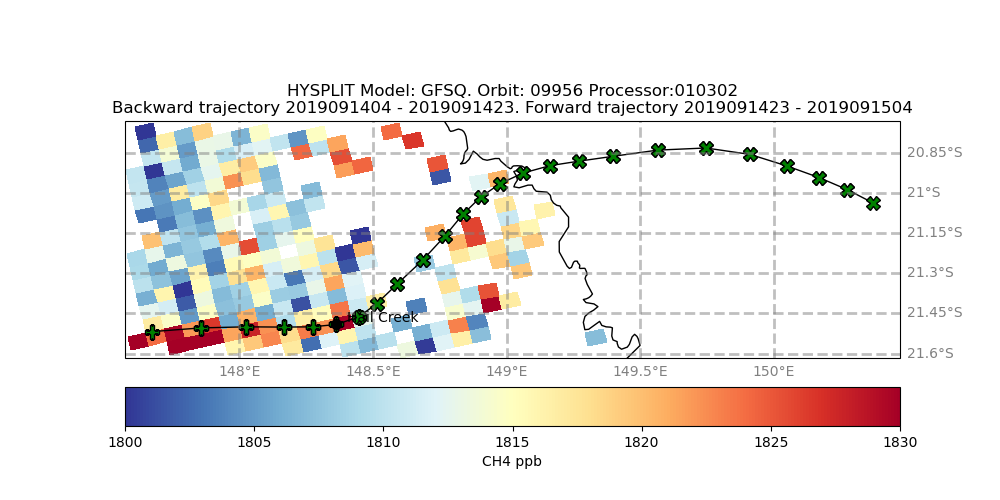
To aid interpretation of the HYSPLIT results, we consider two representative trajectories shown in Figure 2 . The first is a forward trajectory initiated at the Hail Creek mine at 2019-09-14 23 Z. Each + marker along this trajectory marks the location of an emission puff released at that time, tracked forward until approximately 2019-09-15 04 Z, corresponding to the TROPOMI overpass.
Because turbulent diffusion causes emissions within a puff to mix into the surrounding air mass arriving at Hail Creek at 2019-09-14 23 Z, estimating the background concentration requires information on the origin of that air mass. For this purpose, a backward trajectory is also shown in Figure 2, indicated by x symbols. This trajectory traces the air parcel backward in time for 19 hours, terminating at 2019-09-14 04 Z, which corresponds to the time of the previous day's TROPOMI overpass.
Together, these forward and backward trajectories represent the path of a single air parcel that originated over the Pacific Ocean at 2019-09-14 04 Z (the time of the TROPOMI overpass for orbit 09942), travelled westward to pass over the Hail Creek mine at 2019-09-14 23 Z, and then continued westward until 2019-09-15 04 Z, corresponding to the TROPOMI overpass for orbit 09956.
Figure 2. HYSPLIT . A single forward and a single backward trajectory for an air parcel passing over Hail Creek on 20190914 at 23Z. TROPOMI. Orbit 09956. Processor 010302.
Like any numerical model, HYSPLIT has inherent limitations. The model developers provide a detailed discussion of these limitations on the HYSPLIT project website (see HYSPLIT Limitations ). For the purposes of this report, the following limitation is particularly relevant:
Meteorological data used to force HYSPLIT is available at relatively coarse temporal resolution (1-6 hours), which can result in errors in rapidly changing conditions, even if the NWP model itself can faithfully emulate these conditions. NWP models also have limitations in their ability to accurately forecast the onset and spatial scales of phenomena that may affect dispersion, such as sea-breezes and mountain-valley circulations.
For this modelling, we used GFS meteorological data with a spatial resolution of 0.25° (approximately 25 ()). At this scale, the model cannot realistically represent local emission sources or fine scale wind fields, as the complex topography of the open cut mine, approximately 4 () in length and 1 () in width, lies well below the grid resolution. Similarly, the model cannot be expected to capture local flow features that develop under nocturnal inversion conditions. Resolving such processes would require a chemical transport model operating at sub kilometre scale resolution (≈ 0.5 () or finer).