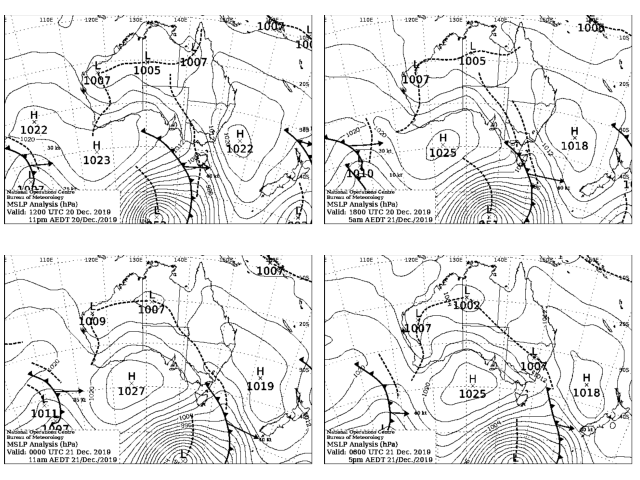
Orbit 11332 was selected as a case study because it provides relatively complete pixel coverage and exhibits substantial turbulent mixing throughout the night, preventing the formation of an SNBL. This pattern is the most suitable for applying the CSF method, as it avoids the complexities associated with SNBL conditions.
Mean Sea Level Pressure
The dominant synoptic feature in this late spring case is the STR extending from a high pressure system south of Perth to another located east of the New South Wales coast. A secondary feature is a trough extending inland from the Gulf of Carpentaria to the west of Hail Creek. Together, these two slow moving high pressure systems and the intervening trough produce a steady east to northeast flow throughout the 24 hour period.
Observations show a minimum wind speed of 9.4 () at 18 UTC, along with cloud cover between 780 () and 1300 () during the early morning period from 17 UTC to 00 UTC. This combination of sustained winds and cloud cover prevented the formation of an SNBL.
Table 22. Moranbah Airport AWS observations between 2019-12-20 4Z and 2019-12-21 4Z. Download
Date
Air temperature ()
Dew point ()
Wind speed ()
Wind direction in degrees true
20/12/2019 04:00
33.7
10.9
22.3
130
20/12/2019 04:30
33.7
11.5
22.3
90
20/12/2019 05:00
34.4
10.3
24.1
110
20/12/2019 05:30
34.3
10.2
20.5
110
20/12/2019 06:00
35.1
11.5
24.1
130
20/12/2019 06:30
34.3
10.8
14.8
100
20/12/2019 07:00
34.9
10.0
22.3
90
20/12/2019 07:30
34.3
10.2
18.4
120
20/12/2019 08:00
33.8
9.1
18.4
60
20/12/2019 08:30
33.0
9.7
20.5
80
20/12/2019 09:00
32.0
10.1
16.6
70
20/12/2019 09:30
30.6
12.5
22.3
50
20/12/2019 10:00
29.7
14.7
20.5
70
20/12/2019 10:30
29.0
15.2
20.5
80
20/12/2019 11:00
27.9
15.5
22.3
70
20/12/2019 11:30
26.9
15.6
20.5
80
20/12/2019 12:00
25.7
15.7
22.3
80
20/12/2019 12:30
24.9
15.0
18.4
90
20/12/2019 13:00
24.1
15.3
14.8
110
20/12/2019 13:30
23.6
15.9
14.8
100
20/12/2019 14:00
23.1
16.2
13.0
110
20/12/2019 14:30
22.9
16.2
16.6
90
20/12/2019 15:00
22.3
16.1
13.0
100
20/12/2019 15:30
21.5
16.2
11.2
130
20/12/2019 16:00
21.2
16.4
13.0
130
20/12/2019 16:30
21.2
16.6
14.8
130
20/12/2019 17:00
20.9
16.5
13.0
140
20/12/2019 17:30
20.7
16.5
13.0
140
20/12/2019 18:00
20.0
16.2
9.4
130
20/12/2019 18:30
19.9
16.5
11.2
140
20/12/2019 19:00
19.6
16.4
13.0
130
20/12/2019 19:30
20.0
16.8
13.0
130
20/12/2019 20:00
20.9
17.3
14.8
130
20/12/2019 20:30
22.6
17.7
18.4
130
20/12/2019 21:00
23.1
17.6
20.5
120
20/12/2019 21:30
24.5
17.5
20.5
120
20/12/2019 22:00
24.8
17.3
18.4
80
20/12/2019 22:30
26.4
17.2
20.5
110
20/12/2019 23:00
26.4
16.1
16.6
60
20/12/2019 23:30
28.4
16.3
20.5
100
21/12/2019 00:00
29.3
15.8
18.4
100
21/12/2019 00:30
28.9
15.1
18.4
120
21/12/2019 01:00
30.8
14.4
16.6
80
21/12/2019 01:30
31.4
15.0
9.4
150
21/12/2019 02:00
31.6
13.8
18.4
90
21/12/2019 02:30
33.3
13.9
16.6
90
21/12/2019 03:00
34.7
13.5
18.4
90
21/12/2019 03:30
35.2
12.2
16.6
80
21/12/2019 04:00
34.7
11.2
24.1
90
TROPOMI
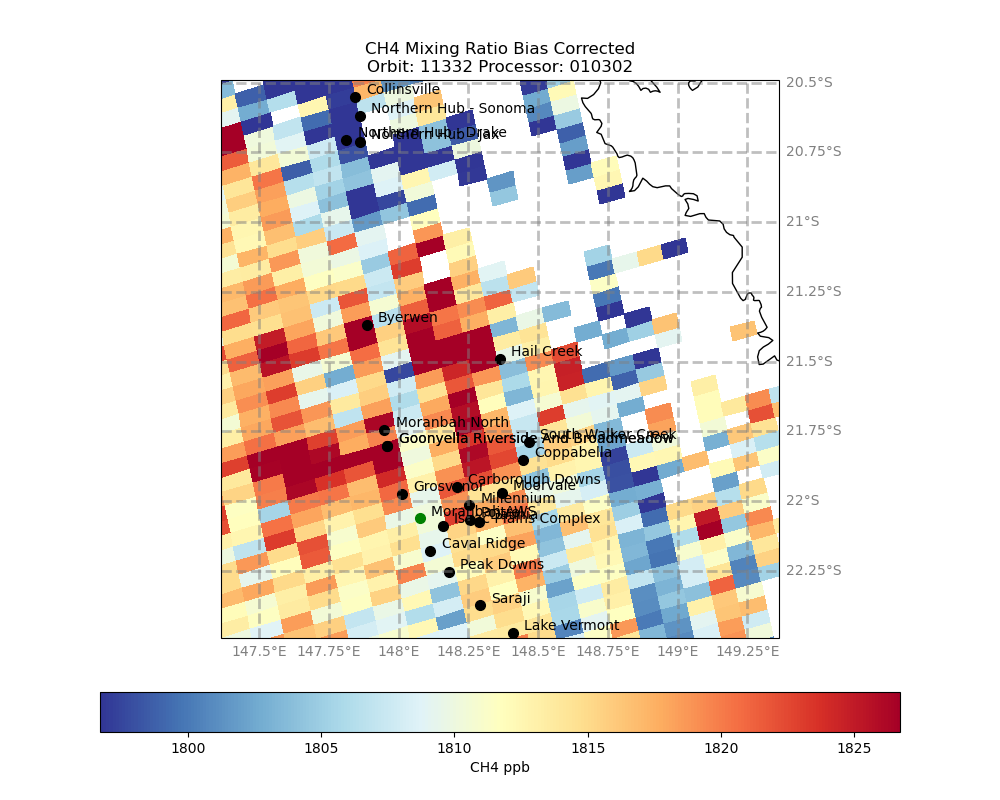
The TROPOMI data, consistent with the regional flow, show lower concentrations in the north and northeast of the scene and elevated concentrations to the west of Hail Creek and the Bowen Basin. The image exhibits significant striping, and many pixels over the ranges are missing.
Figure 38. TROPOMI image centred at Hail Creek mine. Orbit 11332. Processor 010302.
HYSPLIT
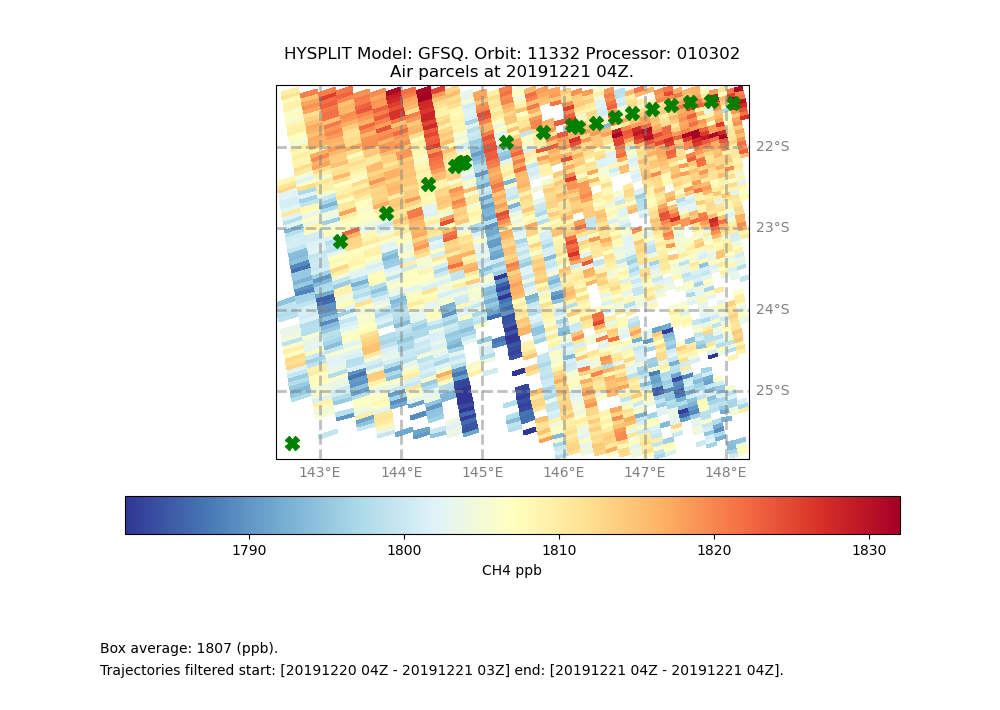
HYSPLIT was run in forward mode for 24 hourly emission puffs released from the Hail Creek mine prior to the satellite overpass. The centre of the resulting plume, extending west and south, is formed by these puffs at the time of the TROPOMI image and is shown in Figure 39. The puff endpoints at the time of the image are uniformly distributed, indicating a nearly constant east to northeast wind throughout the simulation period.
Figure 39. HYSPLIT Location of emission puffs from Hail Creek emitted every hour between 2019122004Z and 2019122103Z at 2019122104Z. TROPOMI. Orbit 11332. Processor 010302.
To estimate the background concentration, backward trajectories were computed for 23 emission puffs. The origins of these trajectories are shown in Figure 40. As in the case of orbit 09956, most of the air parcels originate over the Pacific Ocean.
Figure 40. HYSPLIT Location of emission puffs from Hail Creek emitted every hour between 2019122004Z and 2019122103Z at for 2019122104Z. TROPOMI. Orbit 11332. Processor 010302.
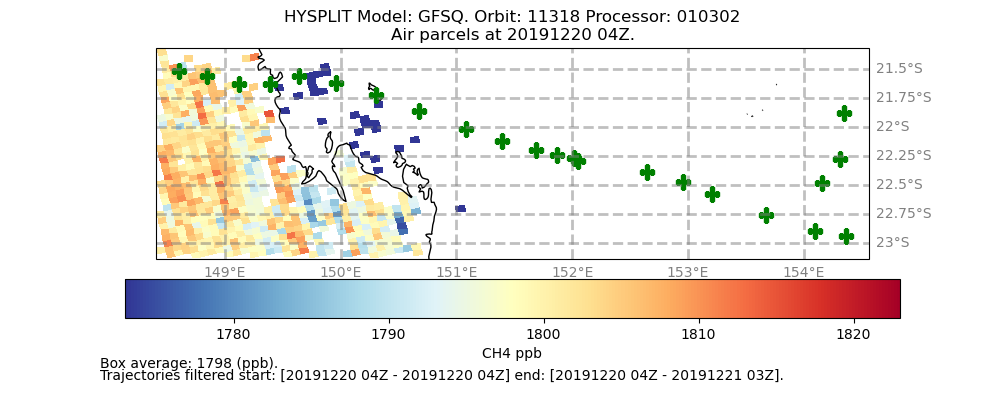
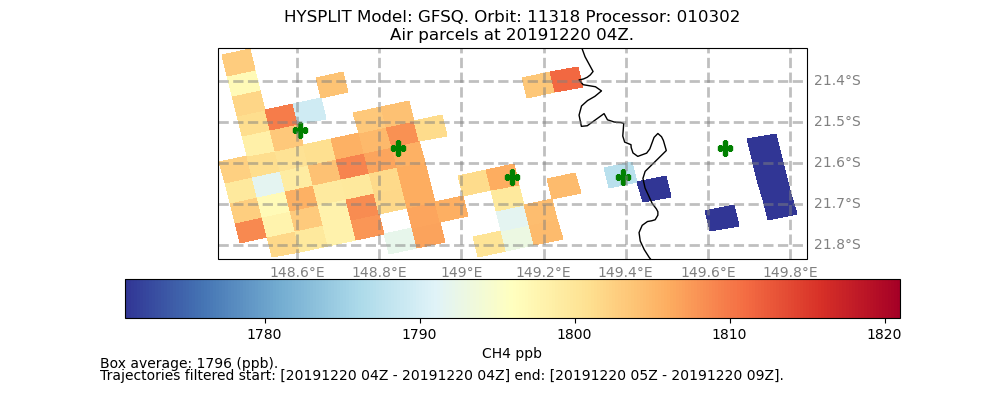
A zoomed in view of Figure 40, presented in Figure 41, shows four background puffs for which concentrations are known at the time of the preceding satellite overpass (orbit 11318). These background puffs would have reached Hail Creek between 05Z and 09Z on 20 December 2019.
Figure 41. HYSPLIT . Location of background puffs reaching Hail Creek every hour between 2019122005Z and 2019122009Z. TROPOMI. Orbit 11318. Processor 010302.
HYSPLIT forward modelling indicates a relatively steady flow, supporting the applicability of the CSF method in this case. However, as before, it is not possible to determine the background concentration: the backward trajectories for emissions within the downwind box originate from air parcels located over the ocean during the previous day's overpass, where no TROPOMI data are available.
CSF
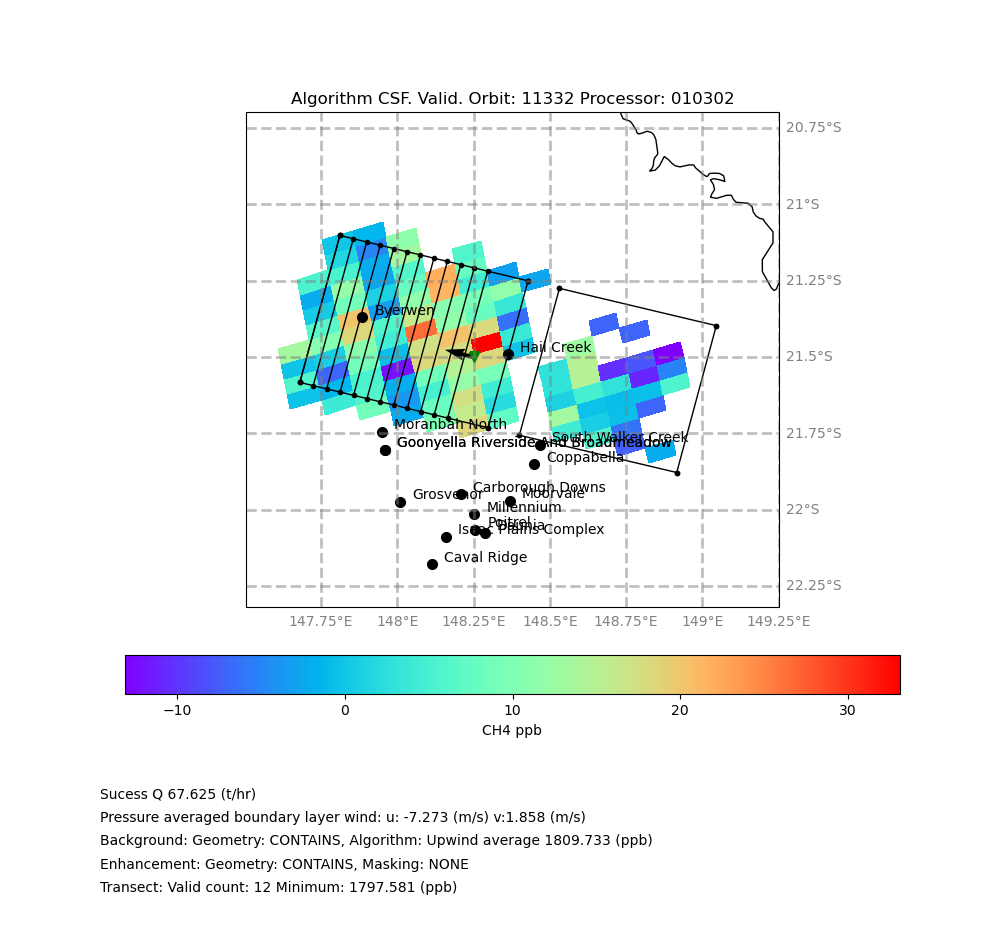
Inspection of the valid pixels shows good coverage within the downwind box. The downwind box measures 66 () in length and 55 () in width, reflecting a substantial influence of striping on its dimensions. The upwind box is positioned over the mountains and has an average concentration of 1809.733 (). See Figure 42. Notably, the downwind box also encompasses the Byerwen coal mine.
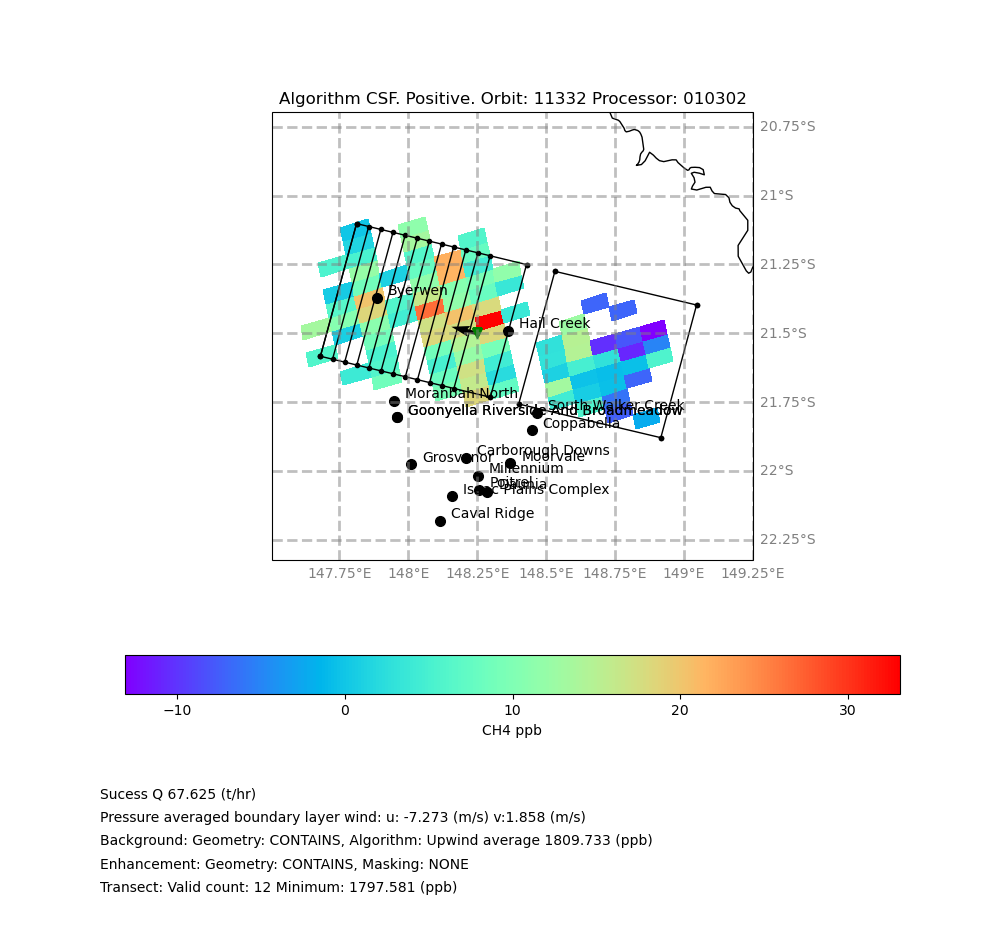
Inspection of the positive pixels, representing the inferred plume, reveals an unusual pattern, with the plume occupying almost the entire rectangular box and being dominated by the first three pixel columns west of Hail Creek. The algorithm reported a successful retrieval, with an emission rate of 67.625 (). See Figure 43
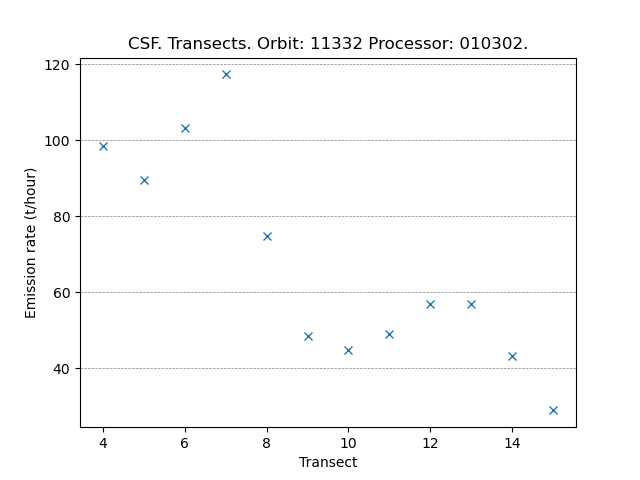
Analysis of the transects shows substantial variability in the estimated emission rates, with very high values in transects 4-7 that drop by roughly 50% in transects 8-15. This pronounced non-uniformity may have several causes—for example, rapidly varying emission rates, or more plausibly, difficulties in accurately determining the plume shape and background concentration. See Figure 44.
The emission rate reported for this case in the original study was 42.1 ().
TM
TM is not applicable in this case because there is mass flow across the boundary.
IME
IME is not applicable in this case because there is mass flow across the boundary.
Summary
This case study was selected because relatively steady wind conditions persisted for 24 hours with no evidence of SNBL development. These conditions are ideal for the CSF method, with HYSPLIT modelling showing a relatively straight plume.
The TROPOMI image provides very good coverage downwind of the Hail Creek mine; however, significant striping is evident. This striping likely caused the downwind box width to be substantially overestimated. As in the previous cases, there is no objective information available to reliably determine the plume shape or background concentration.
The TM and IME methods are not applicable in this case.