Emission rates
The algorithm was applied to 109 filtered orbits. Of these, 41 were rejected due to an insufficient number of transects or the presence of light winds. Calculations were completed for the remaining 68 orbits, yielding a mean emission rate of
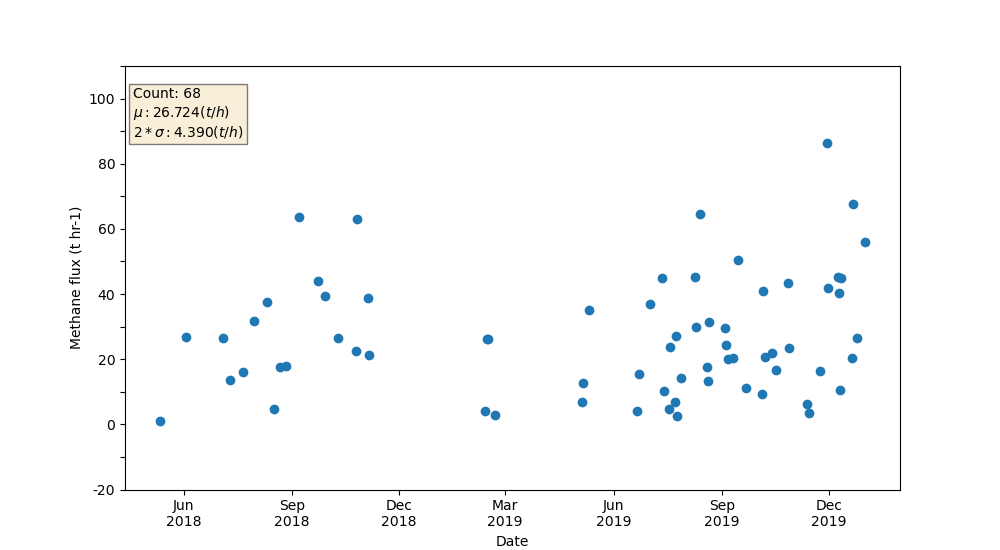
Following our assessment of the algorithm's limitations, we removed orbits in which transects contained fewer than 15 positive-enhancement pixels, as well as orbits with an unusually large number of valid pixels intersected by transects (> 70) pixels. After applying these filters, 35 orbits remained, yielding an annualised emission estimate of
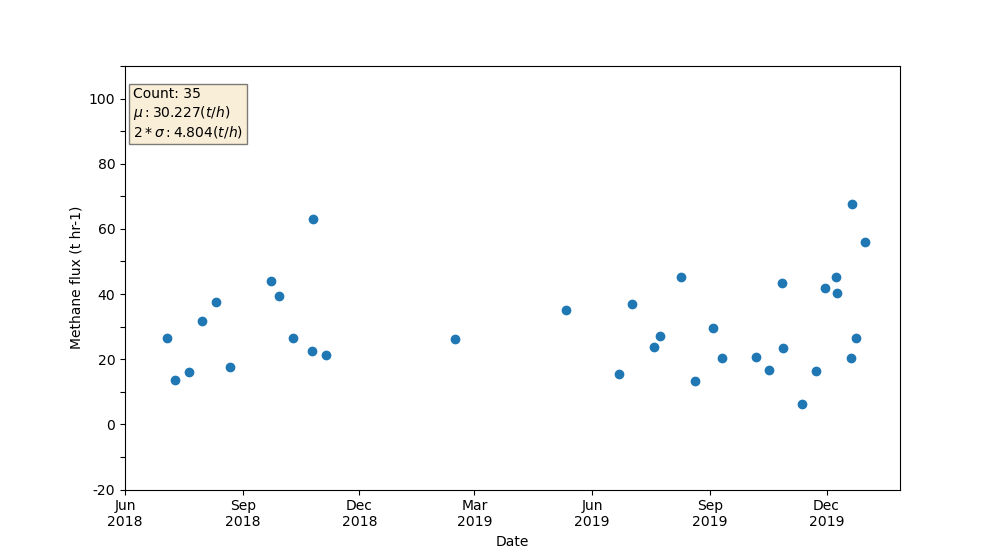
A comparison of our reproduced results with Figure 2 of
- Number of orbits used: Our dataset contains more data points. While
Sadavarte, et al., 2021 report selecting 32 orbits out of 53, our reproduction began with 109 orbits passingTROPOMI filters. After excluding orbits affected by low winds or insufficient transects, 68 remained. Applying additional filters for low/high pixel counts further reduced this to 35 orbits. - Maximum emission values: The maximum values in our reproduction are slightly higher than those reported in the original study. This may reflect differences in the
TROPOMI filtering criteria applied in the original analysis. - Confidence interval: The confidence interval of the mean is smaller in our results, likely due to filtering out cases with unphysically large plume domains.
- Negative emissions: Our calculations do not produce negative emission rates, which is likely due to different definition of enhancement and/or not subtracting contributions from other sources.
Overall, considering the uncertainties inherent in the algorithm and the absence of corrections for external sources, the reproduced emission rates agree reasonably well with the original results.
Implied emission factor
Using the filtered annualised emissions and the activity data reported in
This value is slightly higher than the
Using production data from the
This value is slightly lower than the